One of the benefits of Salesforce Marketing Cloud Account Engagement (Pardot) over other Marketing Automation tools is its increasingly seamless integration with Salesforce CRM products.
Since your sales teams work inside Salesforce CRM all day, adding some useful Pardot data to their existing ecosystem and views can enable them to perform better and faster.
And for Sales and Marketing Managers, Directors, and Operations folks, the ability to add Pardot data to their existing Salesforce dashboards can help them understand marketing performance from a macro level, as well as a micro level.
In this blog post, I will go over a few key Pardot metrics I like to add to reports as well as lead, contact and campaign object page layouts, in Salesforce, and how I go about doing it.
Enable Connected Campaigns and Engagement History
Before proceeding further, you need to ensure you are using Salesforce Lightning and have enabled the Pardot Lightning app in Salesforce. Here is a guide.
In addition to the Lightning app, you will need to ensure connected campaigns and engagement history are both enabled and working, as this is what will allow Pardot to send data to Salesforce, to make our reports.
To enable connected campaigns, log in to pi.pardot.com and in the top right click the settings gear icon and edit the account settings. Scroll down to the connected campaigns section and Enable everything on there. Like this: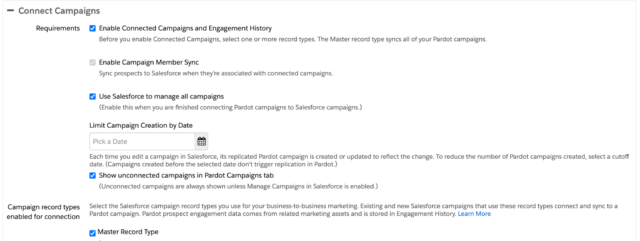 Next, to enable Engagement history, in Salesforce, Click the settings gear icon in the top right, and in the quick find search box on the left side, search for “Engagement History”. Click the toggle to Enable engagement history dashboards and then click “Go to report type setup” to start creating custom report types.
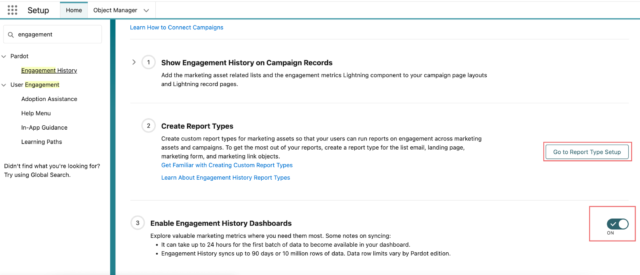
Create Custom Report Types
With Engagement history enabled, we can start creating custom report types. These will allow us to create reports for emails, forms and other data.
If you are not already on the custom report types screen, you can get there by going to settings, and searching for “report types” and it should pop up. Click “New Custom Report Type”.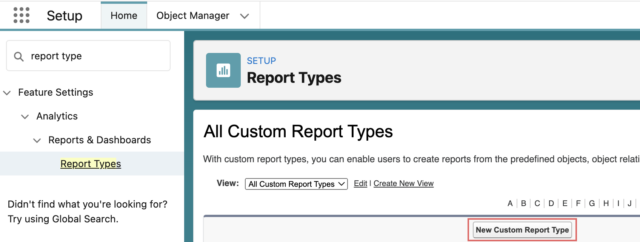 Here are the four report types you can now create:
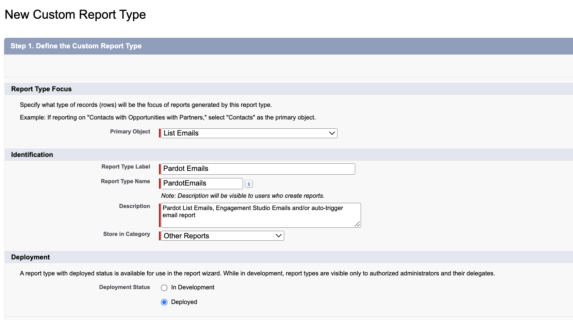
- List Emails Report Type
 Report on list emails (one-time sends, such as newsletters), Engagement Studio emails (Email Drip Sequences and Journeys) and/or other automated emails (such as form auto-trigger emails)
 Report on list emails (one-time sends, such as newsletters), Engagement Studio emails (Email Drip Sequences and Journeys) and/or other automated emails (such as form auto-trigger emails)
- Marketing Forms Report Type
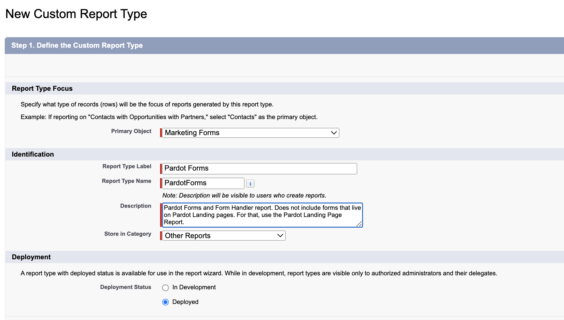
 Report on Pardot forms (forms built inside Pardot) and/or form handlers (Forms on your website connected to Pardot). This includes Pardot forms housed in iframes and embedded on your website, pardot forms you link to directly and form handlers. This does NOT include pardot forms that are used in Pardot landing pages.
 Report on Pardot forms (forms built inside Pardot) and/or form handlers (Forms on your website connected to Pardot). This includes Pardot forms housed in iframes and embedded on your website, pardot forms you link to directly and form handlers. This does NOT include pardot forms that are used in Pardot landing pages.
- Landing Pages Report Type
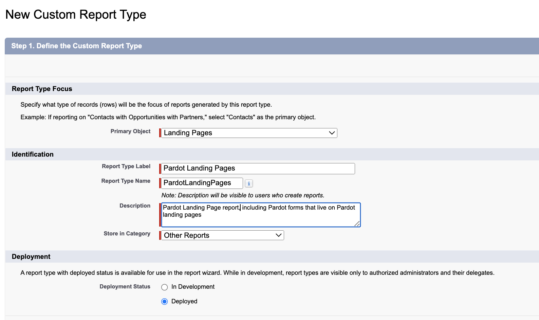
 Report on landing page performance, including landing page views, conversions of Pardot forms located on landing pages, and the corresponding submission rates.
 Report on landing page performance, including landing page views, conversions of Pardot forms located on landing pages, and the corresponding submission rates.
- Marketing Links Report Type
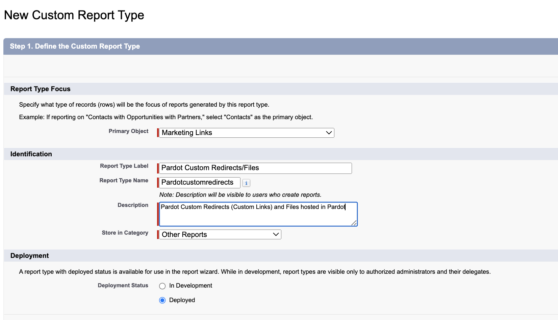
 If you create custom redirects in Pardot (these are basically bit.ly-like tracking links) or host files in Pardot (ie whitepapers and such), you can report on clicks and downloads of these.
 If you create custom redirects in Pardot (these are basically bit.ly-like tracking links) or host files in Pardot (ie whitepapers and such), you can report on clicks and downloads of these.
When I have a form or email that links to a PDF whitepaper download for example, I like to create a custom redirect, such that rather than going straight to the whitepaper, for a second, the prospect first hits the custom redirect. This way, we can track how many people downloaded the whitepaper and who those people were.
Tweak Sharing Settings
Just one last step before you are done with the report type setup. For some reason, by default, for the list emails object, even if you set everything up properly, some users will not be able to view your reports without special permissions. I like to make this easier for everyone by tweaking the organizational sharing settings to ensure Email reports can easily be viewed by everyone who has the link in your organization.
Simply hit the settings gear icon in the top right corner or Salesforce, and in the quick find search box type in “sharing” and pull up the sharing settings. Edit such that “List Emails” is “Public Read/Write”, like so: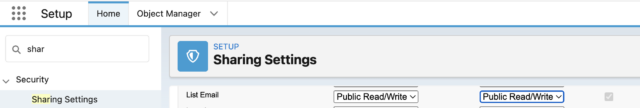
Create your Reports
Now that you’ve created your report types, which are like templates, you and your users can start creating reports based on these. If you want to, you can then also add these reports to your Salesforce dashboards.
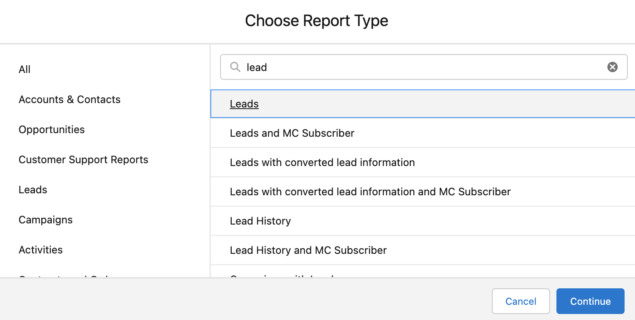
In Salesforce, click on Reports and make a New Report. Search for “Pardot” and the four report types you just created will pop up.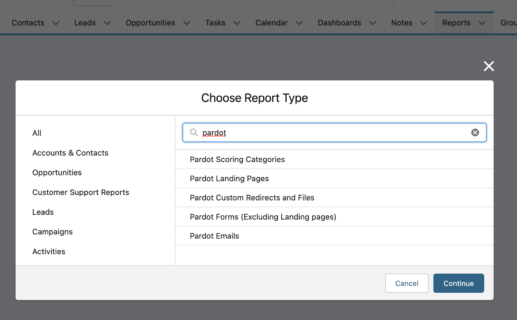 From there you can create whatever reports you like. The possibilities are endless. Here are a couple of samples:
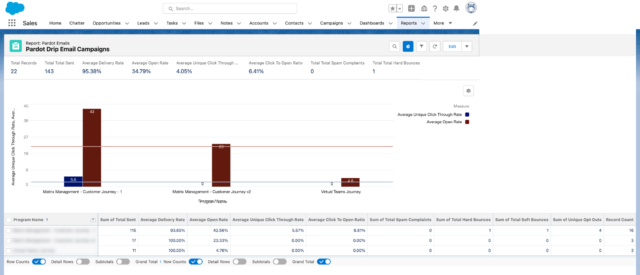
- Email performance by Email Sequence
 How are your email sequences doing? How do they compare to industry benchmarks? How do they compare with your other email sequences? Which emails need to be tweaked?
 - Email performance by Newsletter
 How did last week’s newsletter compare to previous ones? Based on average open rates, what subject lines have historically done well? Based on Click to Open rates, what type of content seems to do best?
 - Forms and Form Handlers
 What Forms are prospects interacting with the most? What type of content is being downloaded? How many people downloaded a demo? How are marketing campaigns converting?
 How are your email sequences doing? How do they compare to industry benchmarks? How do they compare with your other email sequences? Which emails need to be tweaked?
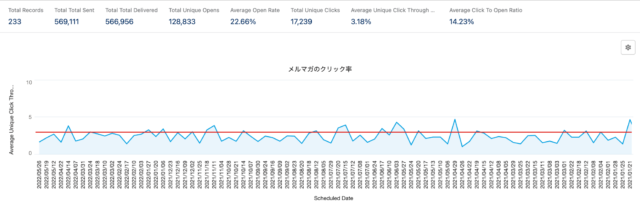 How did last week’s newsletter compare to previous ones? Based on average open rates, what subject lines have historically done well? Based on Click to Open rates, what type of content seems to do best?
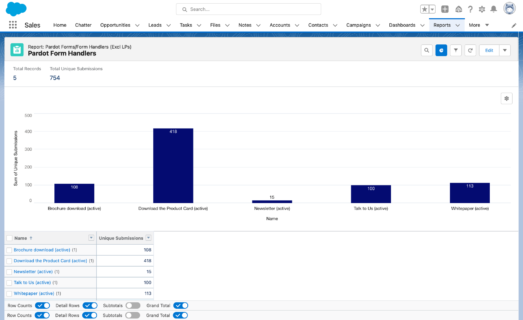 What Forms are prospects interacting with the most? What type of content is being downloaded? How many people downloaded a demo? How are marketing campaigns converting?
Now that you built your reports, customized them and added them to your dashboards, marketers and managers in your organization can be enabled. But now, let’s focus on enabling sales people as well, by adding this useful data to the lead, contact and campaign page layouts that they spend their days looking at.
First, let’s tweak the lead and contact page layouts. In the below example I will start with leads, but once finished you should repeat the process in the same way, for the contact object as well.
Add Pardot data to Lead and Contact page layouts
In Salesforce, click the gear icon and go to settings. Click on Object Manager and pull up Leads (Note: after we finish, we will replicate these steps for Contacts as well)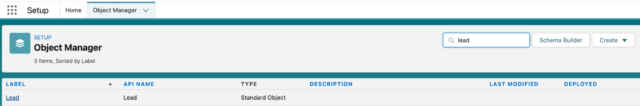 Click on Page Layouts and edit your page layouts. Under the “Fields” area, there are a bunch of cool fields you can add. I like to add these to a new section such as “Pardot” or “Marketing” in the page layout
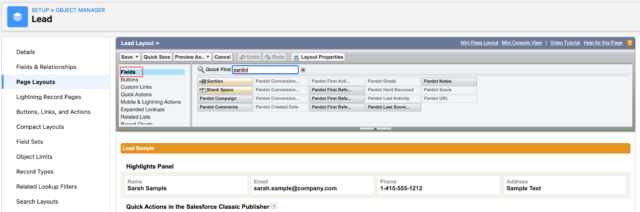
I like to add these fields but the page layout is your oyster: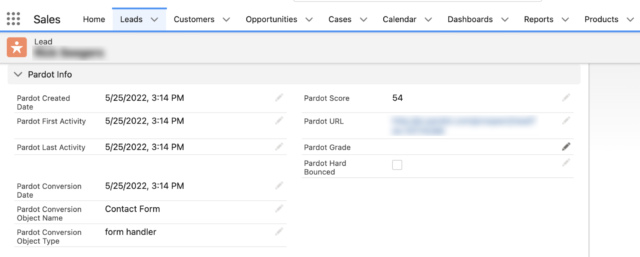 In addition, you can also add some buttons, and actions to your page layouts to allow sales reps to add the lead to a Pardot list or nurturing email campaign and such.
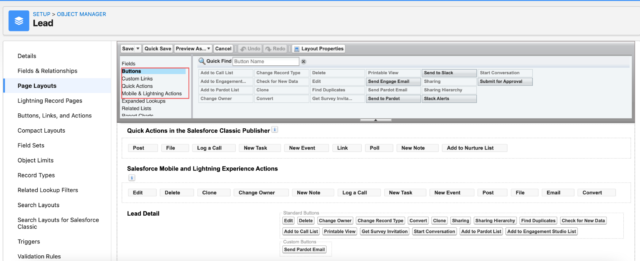 Once that’s done, save your page layout. Next, let’s add an engagement history block to the page, so that sales reps can quickly get an idea of the lead’s digital body language – what pages did they view? What forms did they submit? What emails did they click?All that good stuff.
Staying in the lead object settings, pull up “Lightning Record Pages” and modify your Lightning record page.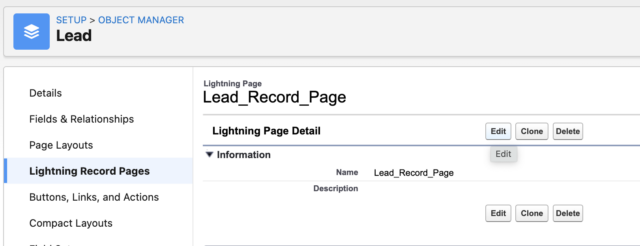 Add Engagement History to the page and save. This will allow you to showcase all the prospect’s activity such as email opens and clicks, page views and form submissions, on the lead or contact page. I like to add it to the right side, like this:
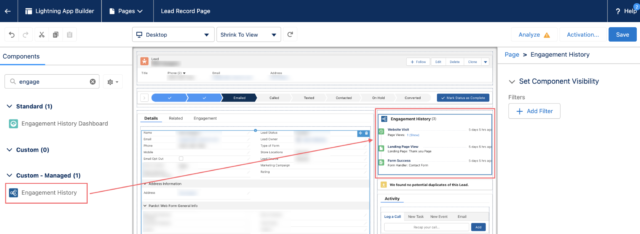 And here is what the final result looks like once saved:
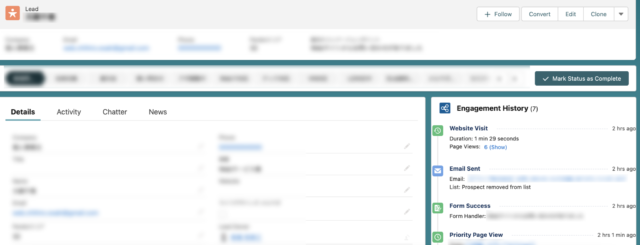 As mentioned, once you have finished adding fields, buttons and engagement history to your lead page, do the same for the contact object.
Modify Campaign Page Layouts
Add Engagement history and related lists to Campaign Page Layouts
While sales mostly live in the lead and contact page layouts, Campaigns are also useful for marketers or sales people, for comparing and analyzing performance of marketing spend, ROI, conversions or activities. It is also just a quick way to bucket a bunch of prospects with a shared lead source. Some examples:
- A campaign for the webinar you did last week: All clicks from email invites, registrants from pardot forms, and attendees from the webinar are captured in the campaign with member statuses
- A campaign for last month’s LinkedIn new product ad campaign: All landing page form conversions from the linkedin ads, nurturing emails, and asset download clicks are captured in the campaign
As you create assets like emails, forms, custom redirects and landing pages all tied to the same campaign, you can use related lists to make sure these are easily visible from the campaign page.
Click on settings and pull up object manager. This time pull up the Campaign object.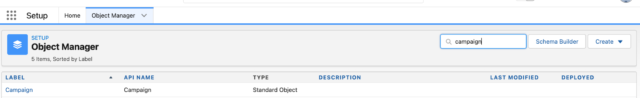 Click page layouts and edit your page layouts. In the related list section, drag your List Emails, Marketing Forms, Landing Pages and Marketing Links related lists to the page layout.
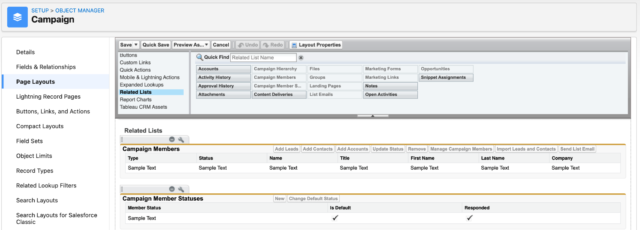 Once saved, again, in the campaign object click lightning record pages on the left side and edit your lightning record page. Drag the Engagement History Metrics Component to your page and save. This engagement history block is super useful for a quick, overall idea of average conversions, click rates and more.
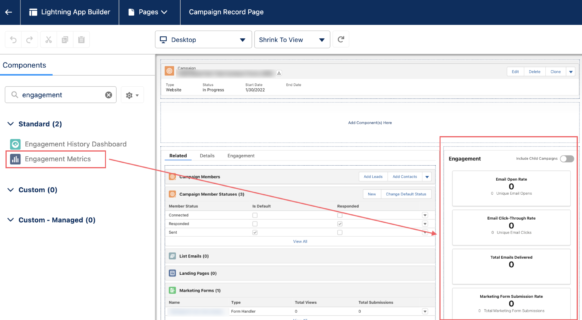 Here is the final result with the related lists and Engagement History Metrics all added
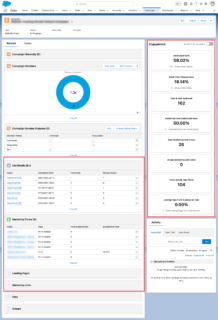
Add Scoring Reports
Add Lead Scoring Buckets to your lead and contact reports
Now that we covered prospect activity and conversion-related metrics, let’s finish off with lead scoring.
A good lead scoring model that has buy-in from all departments, can benefit marketing in helping define what type of leads and campaigns drive quality leads. And it can help overwhelmed Sales people easily decide who to follow up with first, to try to get that sale.
Scoring is great for sales pulling up a lead or lead list view, quickly understanding the prospect’s score and then deciding an action.
But what if marketers or managers want an overall picture of score ranges across all leads. For example, what percent of our database has a score of 0-10, what percent is 11-100 and what percent is 101+?
If we understand this data, we can combine it with further insights, like,
- How do we generate higher scoring leads?
- What types of score ranges are a sweet spot for converting to opportunities?
- How quickly do sales reps follow up with leads, in various scoring ranges?
- Should we stop passing leads to sales if they do not meet a certain threshold?
Here is how I create scoring thresholds in reports, in a quick and easy way; In my example, I will do so for leads and with thresholds of 0-10 vs. 11-100 vs. 101+
In Salesforce, create a new report. It can be a lead or a contact report, but as mentioned, I will go for leads: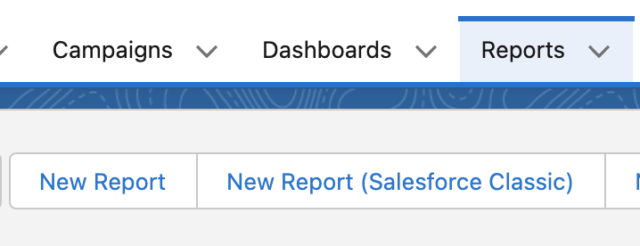
 Set your filters:
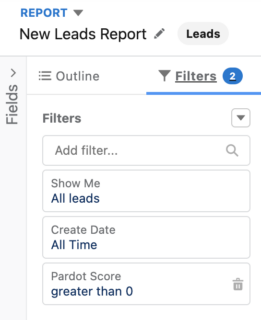 A few points:
- I am eliminating leads with no scores as these are often a huge majority of the database. But you can leave this in if you want to compare this data as well.
- You can also add a created date filter (such as “Created on: THIS QUARTER”) if you want to report only on leads created in a certain date range. Learn more here.
- Of course you can narrow down your criteria further, such as to certain campaigns or demographic or geographic factors, etc.
In the Outline section, Add the fields you want to see in the report and then click “Add Summary Formula”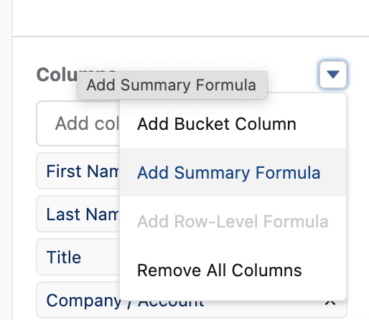
Set it up like the following and use this formula: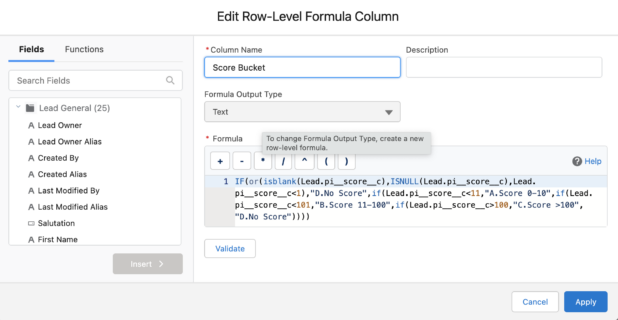 Formula for easy copy and pasting:
IF(or(isblank(Lead.pi__score__c),ISNULL(Lead.pi__score__c),Lead.pi__score__c<1),”D.No Score”,if(Lead.pi__score__c<11,”A.Score 0-10″,if(Lead.pi__score__c<101,”B.Score 11-100″,if(Lead.pi__score__c>100,”C.Score >100″,”D.No Score”))))
A few points:
- This is for leads. For Contact reports, simply replace every instance of “Lead” with “Contact”)
- I am using ranges of 0-10,10-100,100+ but of course you can modify the formula to have the criteria and the labels say whatever you want. This is basically just an IF statement
Next, drag the summary level formula you just created to the “Group Rows” area. Click on the “Add a chart” image and set up a chart…I like to go with a pie chart which shows values and percentages.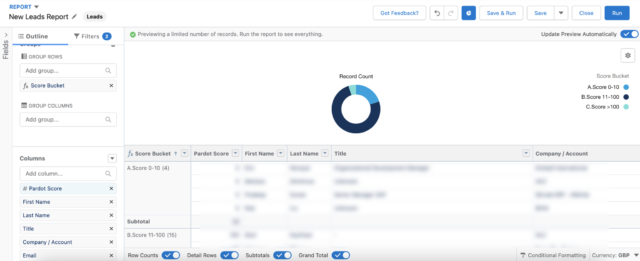 Once saved, it should look like this:
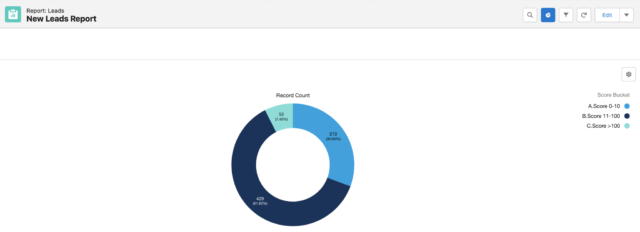 To get in touch with our team of experts, please drop us a line in the form.
Written by Alon Margovskiy, Head of Marketing Automation, Superdrive.
Superdrive is an official Salesforce Partner with Salesforce Certified Marketing Cloud Specialists and Consultants.


 engagement metrics to Salesforce Reports and Pages)