Imagine. End of the quarter is few weeks away. As head of marketing, in your Salesforce instance you run the latest campaign tagged opportunity report or look to your pre-defined dashboards for numbers due to close within the quarter. Outstanding Commit numbers look good; the leads that your team generated months earlier look to have hit the mark, they’ve been converted, moved along in the funnel and you’re in sync with sales. You’re going to hit your contribution numbers for the quarter.
Coming to the close of the month, the final quarter-end snapshot report is shared by your global analytics team and…
Suddenly the Commit numbers you saw in your previous analysis aren’t there anymore and you’re asked to explain the gap!
Eek!
With only days left in the quarter, you scramble your team to compare reports, call meetings with sales and try to identify the gap in an effort to understand and explain where the opportunities went.
It happens.
Be it for legitimate reasons or not, sales numbers can often shift and swing in the final weeks of a quarter.
For the marketing team who aren’t acutely in-sync with the sales and marketing funnel, it can be a significant sap of time and resource to compare and identify opportunity Commit, Close Date and Amount changes based static point-in-time reports in and outside of Salesforce.
Historical Trend Reporting in Salesforce
One reporting feature I often recommend client marketing operational teams as part of their journey in sales and marketing alignment is to utilise Salesforce’s Historical Trend Reporting.
Further to the standard point-in-time reporting on the current state of the sales and marketing funnel, with Historical Trend Reporting you can analyze day-to-day, week-to-week and month-to-month changes in opportunity details. Salesforce retains historical data for the previous three months, plus the current month.
Utilizing this cool feature you as marketing can establish reporting to be more aware, in-tune with sales, knowledgable and front-footed about your lead-converterted funnel:
- Quickly track changes in the pipeline
- Observe increases/decreases in the pipeline over time
- Quickly identify those opportunities that have been pushed back
- Quickly identify those opportunities where the forecast has changed

Source: REPORTING ON HISTORICAL CHANGES IN YOUR DATA
- For example, the above image demonstrates how to:Select the historical Day, Week or Month data value you want to compare today’s results against (you can choose up to 5 historical data points)
- Check the current Opportunity Amount versus the desired historical Day, Week or Month
- Check the current Opportunity Close Date versus the desired historical Day, Week or Month
Suggested Steps to Enable Historical Trend Reporting in Salesforce
The below are two quick steps you as marketing can proactively take right now to either start utilizing or start setting up to utilize Historical Trend Reporting:
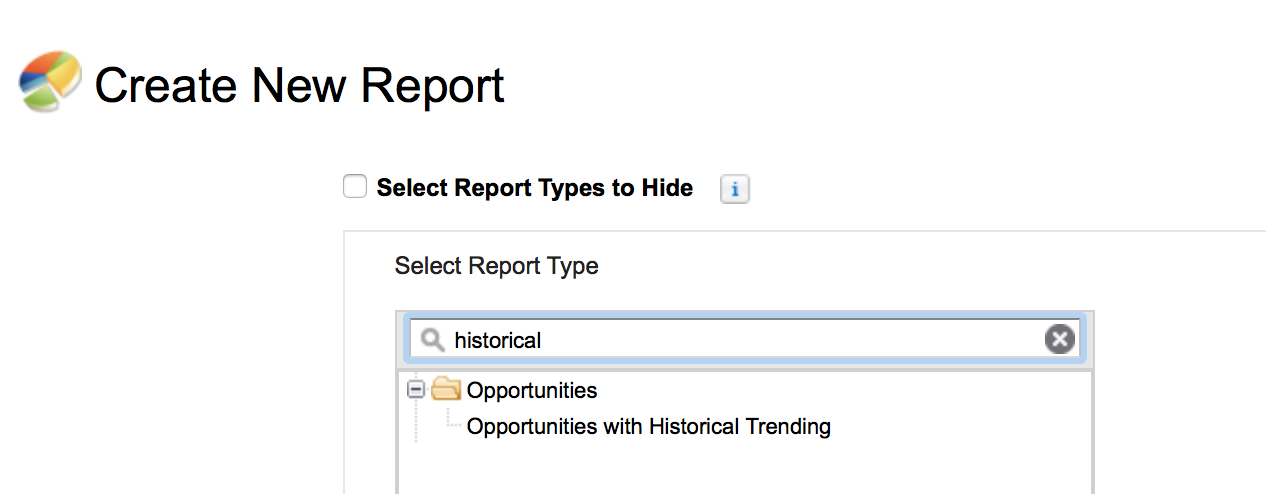
- Check if Historical Trend Reporting is active in your current instance of Salesforce by going to Reports >Create New Report and type historical in the Select Report Type search bar. If ‘Opportunities with Historical Trending’ comes up, you’re in luck! You can start to try out this cool reporting feature with your funnel data (see Image 1.0: Historical Trending Report below)
- If Historical Trend Reporting is not active in your instance, define the request and approach either your Sales Operations Team and/or Administration team via your internal Case Request queue or via email requesting activation along with a business case
Defining Your Request to Sales Operations and/or Administration
As you’d expect, capturing additional data (in the form of historical points at which to reference) increases the amount of data you need to store in your instance of Salesforce. For large organization with big instances of Salesforce, this might be a barrier to activating Historical Trend Reporting.
- To best-as-possible mitigate this potential issue, I recommend starting small and be precise with your ask to Sales Operations and/or Administration when requesting Historical Trend Reporting:
- Start with the Opportunity Object only (As Historical Trend Reporting is available for Opportunities, Cases, Forecasting Items and up to three custom objects)
- Start with the default fields that are trended: Amount, Close Date, Forecast Category, Probability and Stage
- Read and be versed in Salesforce’s Tip Sheet: Historical Trend Reporting for Opportunities to understand the considerations for any specific red-flag limitations in your organization’s Salesforce instance
Finally, make sure you have a solid business case for activating Historical Trend Reporting.
Ultimately, if you aren’t utilizing this feature or something like it within your team, then you may already spend more time than what you want in trying to track changes in the funnel. The premise for activating could very well therefore be legitimately, time efficiencies.
I hope this helps as a starting point for anyone out there with Salesforce who is wanting to shift from reactive reporting to proactive reporting in further driving agile sales and marketing alignment.
Feel free to drop me a note on how you get on or if you just want to share your thoughts and experience.
Good Luck and Happy Historical Reporting!
Andrew Smith – Senior Consultant, Superdrive